This site currently has a Google PageRank of 4 and the majority of the visitors come from search engines such as Google and Yahoo! in search of relevant financial, property and investment information. The readership of this site consists mainly of executives and professionals who are interested in the area of finance, property and investment and residing in Singapore.
As such, marketing your company or brand on this site through advertisements will be a cost-effective way of reaching out to this group of audience. A variety of advertising options are available and these includes graphical banners in different sizes and formats and textual links. The placement of the advertisements on the site can also be tailored to your requirements.
For any advertising enquiries, feel free to contact me at kay@moneytalk.sg
Friday, May 15
Thursday, May 14
Investors hit by short-sale rule
2 comments
Investors hit by short-sale ruleI wish to bring this article to everyone's attention. Currently, SGX impose penalties on those who carry out naked short selling. But as stated in this article, many of these failed trades are made by retail investors who are selling shares held in their CPF without specifying they are CPF trades or their accounts are not properly linked up to SGX. So if you are selling shares held in your CPF, check your orders carefully before submitting. This mistake is an expensive mistake to make.
New SGX rules impose hefty fines on those who sell shares they don't own
By Goh Eng Yeow, Senior Correspondent
(Taken from the Straits Times as part of an article on 13th May 2009)Investors have been told by the Singapore Exchange (SGX) to pay fines of $1,000 or more within five days of failing to settle their trades.
SOME investors rushing back into the red-hot market have been caught out by new rules on short-selling and heavily fined for selling shares that they did not actually own.
They have been told by the Singapore Exchange (SGX) to pay fines of $1,000 or more within five days of failing to settle their trades.
The penalties were introduced last September to deter 'naked' short-selling during a period of near panic on global bourses.
Such short-selling occurs when a trader sells a stock he does not own or has not borrowed in the hope that the price will fall. This would allow him to pocket the difference.
But the SGX appears to be catching an increasing number of 'innocent' investors who fail to deliver small quantities of shares when a trade is due to be settled three days after it is transacted. The trades are usually 1,000 or 2,000 shares of a blue chip like DBS Bank or SingTel.
When investors fail to come up with the shares at settlement, the SGX has to buy the stock on a specially established buying-in market. It then delivers the shares to the buyer on the seller's behalf - as well as levies a hefty fine.
The number of failed trades has risen sharply in line with the rise in daily market volumes. They have more than doubled in the past month, from 1.4 billion shares to 3.7 billion.
Two weeks ago, the SGX buying-in market attracted trading in about 10 to 15 counters a day. By yesterday, the list of counters traded had grown to 50.
Many of these failed trades have apparently been made by retail investors returning to the market after a long absence. They are selling online shares held in Central Provident Fund (CPF) accounts without specifying that they are CPF trades, or their accounts were not properly linked up to the SGX.
One remisier gave the example of a client fined $1,000 after selling 1,000 OCBC shares online.

Monday, May 11
New SGX website
11 comments
 SGX has just launched its new website recently and I am not particularly impressed with the new SGX website. I actually prefer the old SGX website as it's easier to retrieve and find the data that I need. The old layout is also less straining to the eyes as there are more colours and the fonts are bigger.
 SGX has just launched its new website recently and I am not particularly impressed with the new SGX website. I actually prefer the old SGX website as it's easier to retrieve and find the data that I need. The old layout is also less straining to the eyes as there are more colours and the fonts are bigger.
If you are like me, who prefer the old SGX website, you can access one of the pages of the older SGX website here, which will bring you to the marker summary today. From there, you can access the other pages on the old SGX website. It seems to me that the old SGX website is still updated with the latest data.
Thursday, May 7
True performance of STI ETF and Unit Trust
23 comments
I did some research on the performance of local unit trusts which are focused on Singapore recently and compare it with the Straits Times Index and the performance of the STI ETF. The results proved to be quite interesting and I would like to share it my findings in this article.
The performance of unit trusts is often compared with a benchmark index. Thus, for unit trusts which are focused on equities listed on SGX, the appropriate benchmark would be the Straits Times Index. Any unit trusts that are worth your salt must be able to beat the Straits Times Index if you compare them with an appropriate time frame that is sufficently long.
Using data from fundsupermart, I have selected local unit trusts which are focused on equities listed on SGX and compare them with their annualized returns for the past 5 years against the Straits Times Index. You can see the data of these unit trusts in the diagram below and their annualized returns for the past 5 years are highlighted with a purple box.

Data of selected unit trusts from fundsupermart
So how do the performance of these unit trusts fare against the Straits Times Index for the past 5 years ? You can see their performances in the diagram below.

Out of the 8 unit trusts that I have used as a comparison, half of them managed to beat the Straits Times Index and that is quite decent after all. So the STI ETF is not such a terrific investment after all ?
There is one slight difference which is often overlooked. That one crucial difference is that the Straits Times Index, which the unit trusts are benchmarked against, does not take in the account of the giving out of dividends but the STI ETF does give out dividends.
So how much difference do the dividends play a part in affecting the performance of the STI ETF ? This time round, I calculated the 5 years annualized returns of the STI ETF with the effect of dividends being given out using Excel and it can be seen in the diagram below. If you wish to know more about the calculations, Mike from stistocks-info blog has an excellent article which can be found here.

Do take note that the dividends are adjusted for a stock split and the reason why I did not use a longer time frame was because I only managed to find the annualized 5 years and 10 years data for the unit trusts and the STI ETF was only listed in 2002.
As you can see from the diagram above, if you take into the account the effects of dividends, the returns are very different indeed. So how does that stack up with the performance of the unit trusts once again ?

The result is rather obvious. None of the unit trusts managed to beat the STI ETF when the effects of dividends are accounted for in the 5 years time frame that I selected. Do take note that the performances of these unit trusts are calculated on a bid to bid basis, in Sing dollars, with dividends being 'reinvested' at the dividend date as taken from fundsupermart.
However, 5 years is a rather short time frame to be used to compare between different investments. Preferably, I would use a time frame of at least 10 years but due to the limited data that I had, I can only use a time frame of 5 years. Otherwise, this serves well as a preliminary gauge on the performance of the STI ETF and the unit trusts.
Personally, I'm rather surprised by the results of my findings if the data that I have used are indeed correct. So if you are planning to buy a local unit trust that have their focus on equities listed in Singapore, do make a serious consideration before making your decision.
Monday, May 4
Non-Current Assets
No comments
This post is part of a series of posts that discuss about financial statements in detail. To access the other posts in this series, click here.

One of the main components of a balance sheet will be the non-current assets. Non-current assets are assets which are not expected to be converted into cash or used up within the next year. I have highlighted the non-current assets portion with a blue rectangular box in M1's balance sheet.
Fixed Assets - This represents the M1's infrastructure that can includes land, buildings, factories, furniture, equipment and so on. Fixed assets can also be seen in other financial statements as Property, Plant and Equipment or PP&E in short. If you refer to section 10 of the notes to the financial statements, you can see that M1's fixed assets consist of leasehold buildings, networks and related application systems, application systems and computers, motor vehicles and so on.

License and Spectrum Rights - This represents the rights and licenses that M1 has acquired to carry out its operations. For M1's case, this could refer to the rights and licenses to deploy broadband and telecommunication services. License and Spectrum rights can be grouped under intangible assets, which are more commonly seen in financial statements. Intangible assets stands for assets that are not physical in nature. If you refer to section 11 of the notes to the financial statements, you can see a detailed explanation of this component.

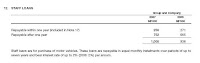
Staff Loans - This component is rather self-explanatory. It stands for the loans that M1 has made to its staff. If you refer to section 12 of the notes to the financial statements, you can see that the loans are related to the purchase of motor vehicles for its staff.
Interest in subsidiaries - This refers to M1's interest in her subsidiaries. Subsidiaries are businesses or companies that are owned by M1. If you refer to section 12 of the notes to the financial statements, you can find out more details about M1's subsidiaries.

In general, these are the main items of the non-current assets in a balance sheet. There can be other components depending on the nature of the industry which the company is in. In my next post, I will be discussing on the main items of the current liabilities in a balance sheet using M1 as an example.

One of the main components of a balance sheet will be the non-current assets. Non-current assets are assets which are not expected to be converted into cash or used up within the next year. I have highlighted the non-current assets portion with a blue rectangular box in M1's balance sheet.
Fixed Assets - This represents the M1's infrastructure that can includes land, buildings, factories, furniture, equipment and so on. Fixed assets can also be seen in other financial statements as Property, Plant and Equipment or PP&E in short. If you refer to section 10 of the notes to the financial statements, you can see that M1's fixed assets consist of leasehold buildings, networks and related application systems, application systems and computers, motor vehicles and so on.

License and Spectrum Rights - This represents the rights and licenses that M1 has acquired to carry out its operations. For M1's case, this could refer to the rights and licenses to deploy broadband and telecommunication services. License and Spectrum rights can be grouped under intangible assets, which are more commonly seen in financial statements. Intangible assets stands for assets that are not physical in nature. If you refer to section 11 of the notes to the financial statements, you can see a detailed explanation of this component.

Staff Loans - This component is rather self-explanatory. It stands for the loans that M1 has made to its staff. If you refer to section 12 of the notes to the financial statements, you can see that the loans are related to the purchase of motor vehicles for its staff.

Interest in subsidiaries - This refers to M1's interest in her subsidiaries. Subsidiaries are businesses or companies that are owned by M1. If you refer to section 12 of the notes to the financial statements, you can find out more details about M1's subsidiaries.

In general, these are the main items of the non-current assets in a balance sheet. There can be other components depending on the nature of the industry which the company is in. In my next post, I will be discussing on the main items of the current liabilities in a balance sheet using M1 as an example.
Subscribe to:
Posts (Atom)


